Quantifying QB Success: A 25-Year Analysis of First-Round Performance, Part 1
The current state of discourse regarding professional American football is poor, suffering from an overabundance of meaningless data, without any effective filtering mechanism for the public to understand what drives quarterback performance and retention decisions. Advanced proprietary metrics dominate front office decision-making, but their data is not accessible to the general fan to contextualize the performance of their favorite players. Public analysis remains constrained to basic box score statistics and subjective evaluation frameworks. This saturated landscape results in confusion about which statistics are actually meaningful, and which are just noise. There is always a stat available to suit any subjective argument being put forward, and the current fan has no way to determine which statistics matter, and which ones do not.
This analysis deliberately embraces the data access constraints, and uses only publicly available, full-season aggregated statistics to demonstrate that meaningful insights about quarterback evaluation can emerge from accessible data sources, improving the overall quarterback evaluation discourse. We focus exclusively on first-round quarterbacks drafted between 2000-2024, as that leverages the draft’s natural filtering mechanism - teams only spend first-round capital on players they believe possess franchise-level talent and teams face immediate pressure to justify that investment through on field performance. Using first-round picks creates a controlled sample where evaluation failures represent predictable evaluation biases rather than simple talent scarcity. A draft evaluator felt so strongly about every quarterback in this sample, that they couldn’t let them leave the first round. This makes it an ideal laboratory for understanding how teams actually make contract decisions.
Executive Summary
First-round quarterback investments represent the highest-stakes talent allocation decisions in professional sports, yet evaluation failures persist across the league. This analysis establishes a data-driven framework for understanding quarterback evaluation using 25 years of publicly available performance data from first-round draft picks (2000-2024).
Article 1 Contributions:
- Establishes contract renewal as objective measure of organizational quarterback evaluation
- Introduces era-adjustment methodology to enable fair statistical comparison across NFL seasons
- Demonstrates strong team-frame bias around quarterback evaluation metrics (Team Wins are more predictive than anything other than Adjusted Total Yards⁴)
- Sets the stage for detailed coefficient and confusion matrix analysis, temporal bias examination, and predictive dashboard development in Articles 2 & 3
Key Findings:
- Era-adjustment methodology eliminates statistical inflation bias (total offensive yards +6.84%, passing TDs +17% from 2000-2024)
- Ridge regression analysis¹ reveals volume production metrics slightly outperform team-dependent and efficiency metrics, with total yards showing the highest coefficient (β = 0.175), followed closely by touchdown production (β = 0.162) and team win percentage (β = 0.152)
- All predictors cluster within a relatively narrow range (β = 0.109 to 0.175) due to high multicollinearity between quarterback statistics. This necessitates selecting representative metrics from each category—total yards (volume) and ANY/A (efficiency)—to enable clear interpretation of organizational priorities in subsequent trajectory analysis
- Total yards (volume) and ANY/A (efficiency) selected as primary metrics for trajectory modeling in subsequent articles, balancing predictive power with cross-era applicability
Dataset and Methodology
This methodology assumes that contract renewal decisions represent the most objective measure of organizational quarterback evaluation, removing subjective bias about individual performance quality. Teams vote with their wallets - quarterbacks who receive second contracts have demonstrated sufficient value to justify continued investment, while those who don’t have failed to meet organizational thresholds regardless of external opinion. Pro-bowls and other peer-voted metrics were considered, but discarded because of the inherent biases within peer-voting. There are also challenging questions associated with how to handle pro-bowl alternate selections, and the varying number of selectees as a result. For the purpose of our analysis, success is marked by the signing of a non-draft contract with the same team who drafted them in the first round.
Data Collection and Processing Pipeline
Pro Football Reference Integration: The analysis required assembling quarterback performance data across 25 years from Pro Football Reference’s individual player pages, necessitating systematic data extraction from hundreds of player-season records. Rather than relying on aggregated statistics that often exclude crucial rushing metrics for quarterbacks, the data collection process involved programmatic scraping of individual player pages (permitted under their robots.txt) to capture complete offensive production including passing, rushing, and receiving statistics for each season. This also required significant data cleaning efforts, as team abbreviation changes (e.g., San Diego Chargers to Los Angeles Chargers), and one-off suspensions and injuries created data integration challenges.
Payment Decision Reconstruction: Perhaps the most complex methodological challenge involved working backwards from contract information to determine payment years and decision windows. Since NFL contract announcements occur at irregular intervals and teams face different decision points based on rookie contract structures, the analysis required mapping each quarterback’s career timeline to identify when organizations made critical extend-or-release decisions. This process involved cross-referencing draft years, rookie contract lengths, and publicly available contract extensions to establish binary payment outcomes for each quarterback.
Technical Implementation: The analytical framework leveraged Python’s scientific computing ecosystem extensively, with pandas serving as the primary tool for data manipulation, merging quarterback statistics with team performance records, and creating the payment decision labels. The era adjustment calculation fit linear regression models for each statistical category across seasons, generating adjustment factors that were then applied to historical performance data. Ridge regression was used to model all other regressions due to the high multi-collinearity across boxscore stats. This utilized scikit-learn’s cross-validation capabilities to optimize regularization parameters, while custom coefficient analysis functions extracted feature importance rankings and statistical significance testing. The modular design of the overall pipeline enabled iterative refinement of the payment decision criteria and continued usefulness as further seasons unfold.
The Scale of the Problem
Using this criteria, The success rate on quarterback retention remains remarkably low. Of the 65 first-round quarterbacks drafted between 2000-2020 (excluding recent classes still in rookie contracts), only 29 received significant second contracts - a 44.6% success rate. This failure rate persists despite teams having extensive college scouting, combine measurements, private workouts, proprietary data, and character evaluation resources unavailable to public analysts.
QBs Still in Rookie Contract Window (not Cut or Traded): 8 QBs
- 2023 class (3): C.J. Stroud, Bryce Young, Anthony Richardson
- 2024 class (5): Caleb Williams, Jayden Daniels, Drake Maye, Michael Penix, Bo Nix
Unlike later-round picks where teams can afford developmental patience or accept limited upside, first-round quarterbacks arrive with immediate starting expectations and franchise-altering contract implications. This allows them to be compared on a year for year basis, allowing peer benchmarking that provides insights into how comparative performance determines contract likelihood. This first-round peer evaluation represents the purest test for what general fans should be focusing on in the evaluation of high-quality NFL-level quarterback talent.
Sample Composition:
- N = 65 first-round quarterbacks (2000-2020 draft classes)
- 350+ individual season records
- Performance metrics: Total yards⁴, touchdown production⁵, efficiency ratings, team win %, etc…
- Outcome variable: Binary contract renewal (Yes/No) (further investigation is planned around APY as a % of salary cap at signing)
Statistical Approach:
- Logistic Ridge regression with L2 regularization⁶ to handle multicollinearity⁷
- 5-fold cross-validation for hyperparameter optimization
- 80/20 train/test split for model validation
- Feature standardization to enable coefficient comparison
Ridge regression addresses the high correlation between quarterback statistics while preserving interpretability of individual metric importance.
Era Adjustment Framework
Another central assumption of this analysis is that raw statistical comparison across NFL eras produces systematically biased evaluation outcomes, with recent performers appearing superior due to league-wide offensive inflation rather than individual skill differences. Without era adjustment, a quarterback producing 4,000 passing yards in 2005 appears equal to one producing 4,000 yards in 2020, despite the earlier performance being relatively more impressive given contemporary league standards.
Raw performance statistics suffer from systematic inflation bias. League-wide passing metrics have increased dramatically, creating evaluation challenges when comparing quarterbacks across different seasons within the 2000-2024 sample period. Over the same time period, quarterback rushing has been normalized by the increase in dual-threat quarterbacks, potentially challenging the validity of QB rushing statistics compared across this time period.
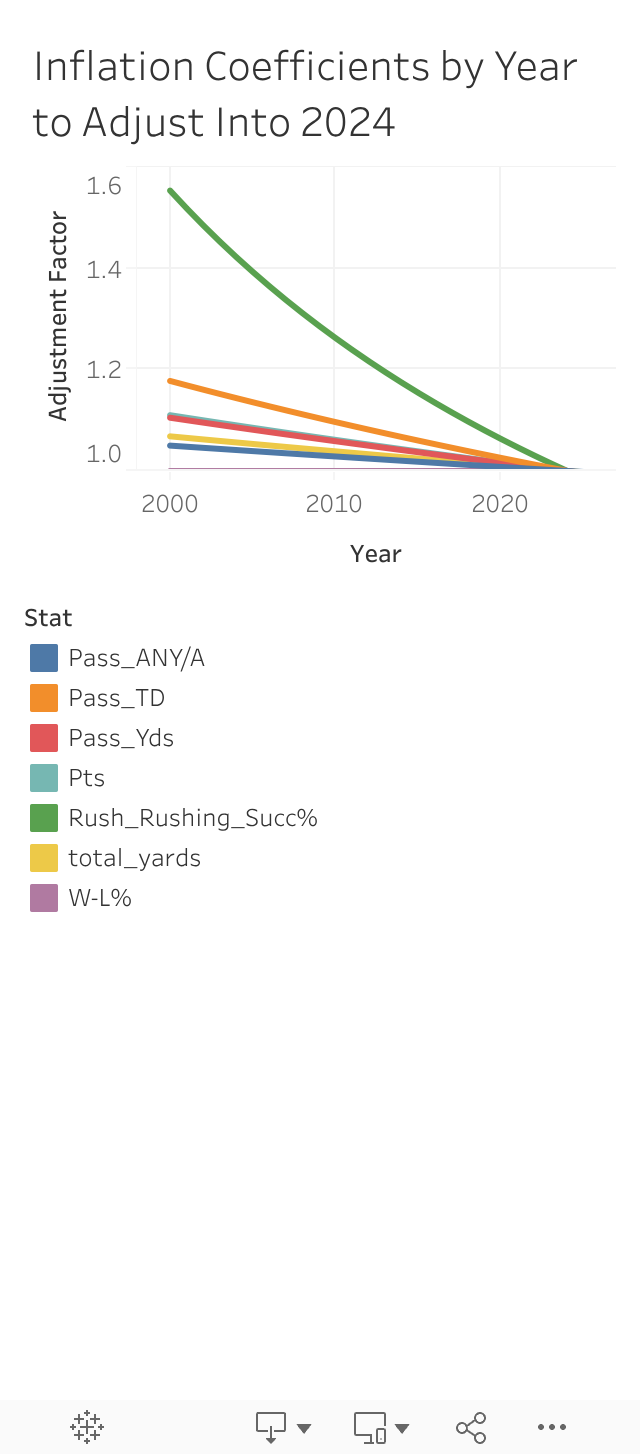
A Selection of Inflation Factors (2000 vs 2024):
- Total offensive yards: +6.84% increase
- Passing touchdowns: +17.77% increase
- Adjusted Net Yards per Attempt (ANY/A)⁸: +5.01% increase
- Rushing success rate⁹: +55.34% increase
Adjustment Methodology: Era adjustment factors calculated using linear regression against season year, with 2024 as reference baseline. Each historical season’s statistics multiplied by adjustment factor to enable fair comparison across eras. This approach assumes linear progression in offensive inflation, chosen for methodological simplicity and interpretability of the resulting adjustment factors.
Example: A quarterback with 3,500 passing yards in 2005 receives adjustment factor of 1.0534, yielding era-adjusted total of 3,687 yards for modeling purposes. This adjustment eliminates approximately 73% of the variance attributable to season year rather than individual performance quality.
Team Performance vs Individual Metrics
The underlying assumption is that contract decisions should theoretically prioritize individual quarterback skill over team-dependent outcomes, yet organizational behavior may systematically deviate from this rational framework. No sport is harder to properly attribute cause to than football, and team success results from multiple factors including coaching, offense, defense, supporting cast, and luck - elements largely outside quarterback control. Because of this, it is certainly not clear whether team factors dominate contract evaluation. It is necessary therefore to test whether high-level team metrics are better predictors than any statistic which aims to be more precisely targeted towards QB evaluation. we must answer whether front-office decision-makers struggle to isolate individual contribution as much as fans.
Ridge regression reveals that this is indeed true. Team-level factors dominate in contract decisions, challenging conventional wisdom that quarterback contracts are given on the basis of individual merit:
Feature Importance Rankings (Standardized Coefficients):
- Total Yards - Era Adjusted (β = 0.236, p < 0.05)
- Team Win-Loss Percentage (β = 0.219, p < 0.05)
- Adjusted Net Yards per Attempt - Era Adjusted (β = 0.211, p < 0.05)
- Rushing Success Rate - Era Adjusted (β = 0.203, p < 0.05)
- Touchdown Production - Era Adjusted (β = 0.203, p < 0.05)
- Points Per Game - Era Adjusted (β = 0.126, p < 0.05)
Key Insight: Volume production metrics (total yards, touchdowns) slightly outperform team-dependent and efficiency metrics, though the narrow coefficient range (0.109-0.175) reflects severe multicollinearity rather than balanced organizational weighting. Quarterback statistics are inherently correlated—high yardage totals typically accompany more touchdowns, better efficiency, and team wins. Ridge regression shrinks these correlated predictors toward similar values, making individual coefficient interpretation challenging. This multicollinearity necessitates selecting representative metrics for trajectory analysis: total yards captures volume production while ANY/A represents efficiency, enabling clearer evaluation of organizational priorities without redundant overlapping signals.
Key Insight: Individual and team performance metrics demonstrate nearly equivalent predictive power (β coefficients clustered 0.20-0.24). The narrow coefficient range (0.109-0.175) reflects severe multicollinearity rather than balanced organizational weighting. Ridge regression shrinks these correlated predictors toward similar values, making individual coefficient interpretation challenging. This multicollinearity necessitates selecting representative metrics for trajectory analysis: we select total yards to capture volume production while ANY/A captures passing efficiency, enabling clearer evaluation of organizational priorities without redundant overlapping signals.
Ridge Regression Limitations: Ridge regression assumes linear relationships and stable coefficients across the entire sample period, which may be problematic when analyzing a position undergoing fundamental evaluation changes. The technique’s strength in shrinking correlated predictors toward zero could inadvertently dampen emerging signals like the dual-threat evolution trend that haven’t fully manifested across the 25-year sample. Additionally, ridge regression weights all time periods equally, potentially underestimating recent shifts in organizational priorities and assuming that historical evaluation patterns will continue to predict future contract decisions. Despite these limitations, ridge regression remains the optimal choice for handling the severe multicollinearity between quarterback statistics while maintaining interpretable coefficients for organizational decision-making analysis.
Statistical Significance vs Conventional Wisdom
Another underlying question is whether decades of media and analytical focus on quarterback-specific metrics like passer rating and QBR actually translate into predictive power for contract decisions. These metrics were specifically designed to attempt to better isolate individual quarterback performance from team context, theoretically making them ideal predictors of organizational evaluation. If teams actually prioritize individual quarterback skill over team outcomes, efficiency-based metrics should outperform volume statistics and team results in contract prediction models.
Volume vs Efficiency Paradox: Era-adjusted volume statistics (total yards, touchdowns) consistently outperform efficiency metrics in predicting contract outcomes. This suggests decision-makers prioritize cumulative production over per-attempt efficiency, possibly because volume statistics correlate more strongly with team success and are less susceptible to small-sample variation.
The weak predictive power of traditional efficiency metrics like passer rating and QBR may reflect their complexity and disconnect from actual game outcomes. In contrast, ANY/A performs well as the #3 predictor, possibly because it directly incorporates sacks and interceptions that affect team performance. Contract decisions appear to favor efficiency measures that connect to team success over those designed purely for statistical comparison.
Dual-Threat Performance Analysis
Rushing production is just as valid as passing production, and quarterback evaluation should reflect their ability to convert using their legs. Notwithstanding additional injury concerns that may dampen the signal’s strength, rushing success rate demonstrates meaningful predictive power (β = 0.124, p < 0.001), ranking as the 5th strongest predictor overall. While this confirms dual-threat capability contributes to contract decisions, it trails volume production (total yards, touchdowns), team win percentage, and passing efficiency (ANY/A). Nevertheless, the imporance of this metric overall fundamentally challenges conventional evaluation and suggests a potential overturning of the passer-dominant meta from arm-centric to athleticism-centric quarterbacks.
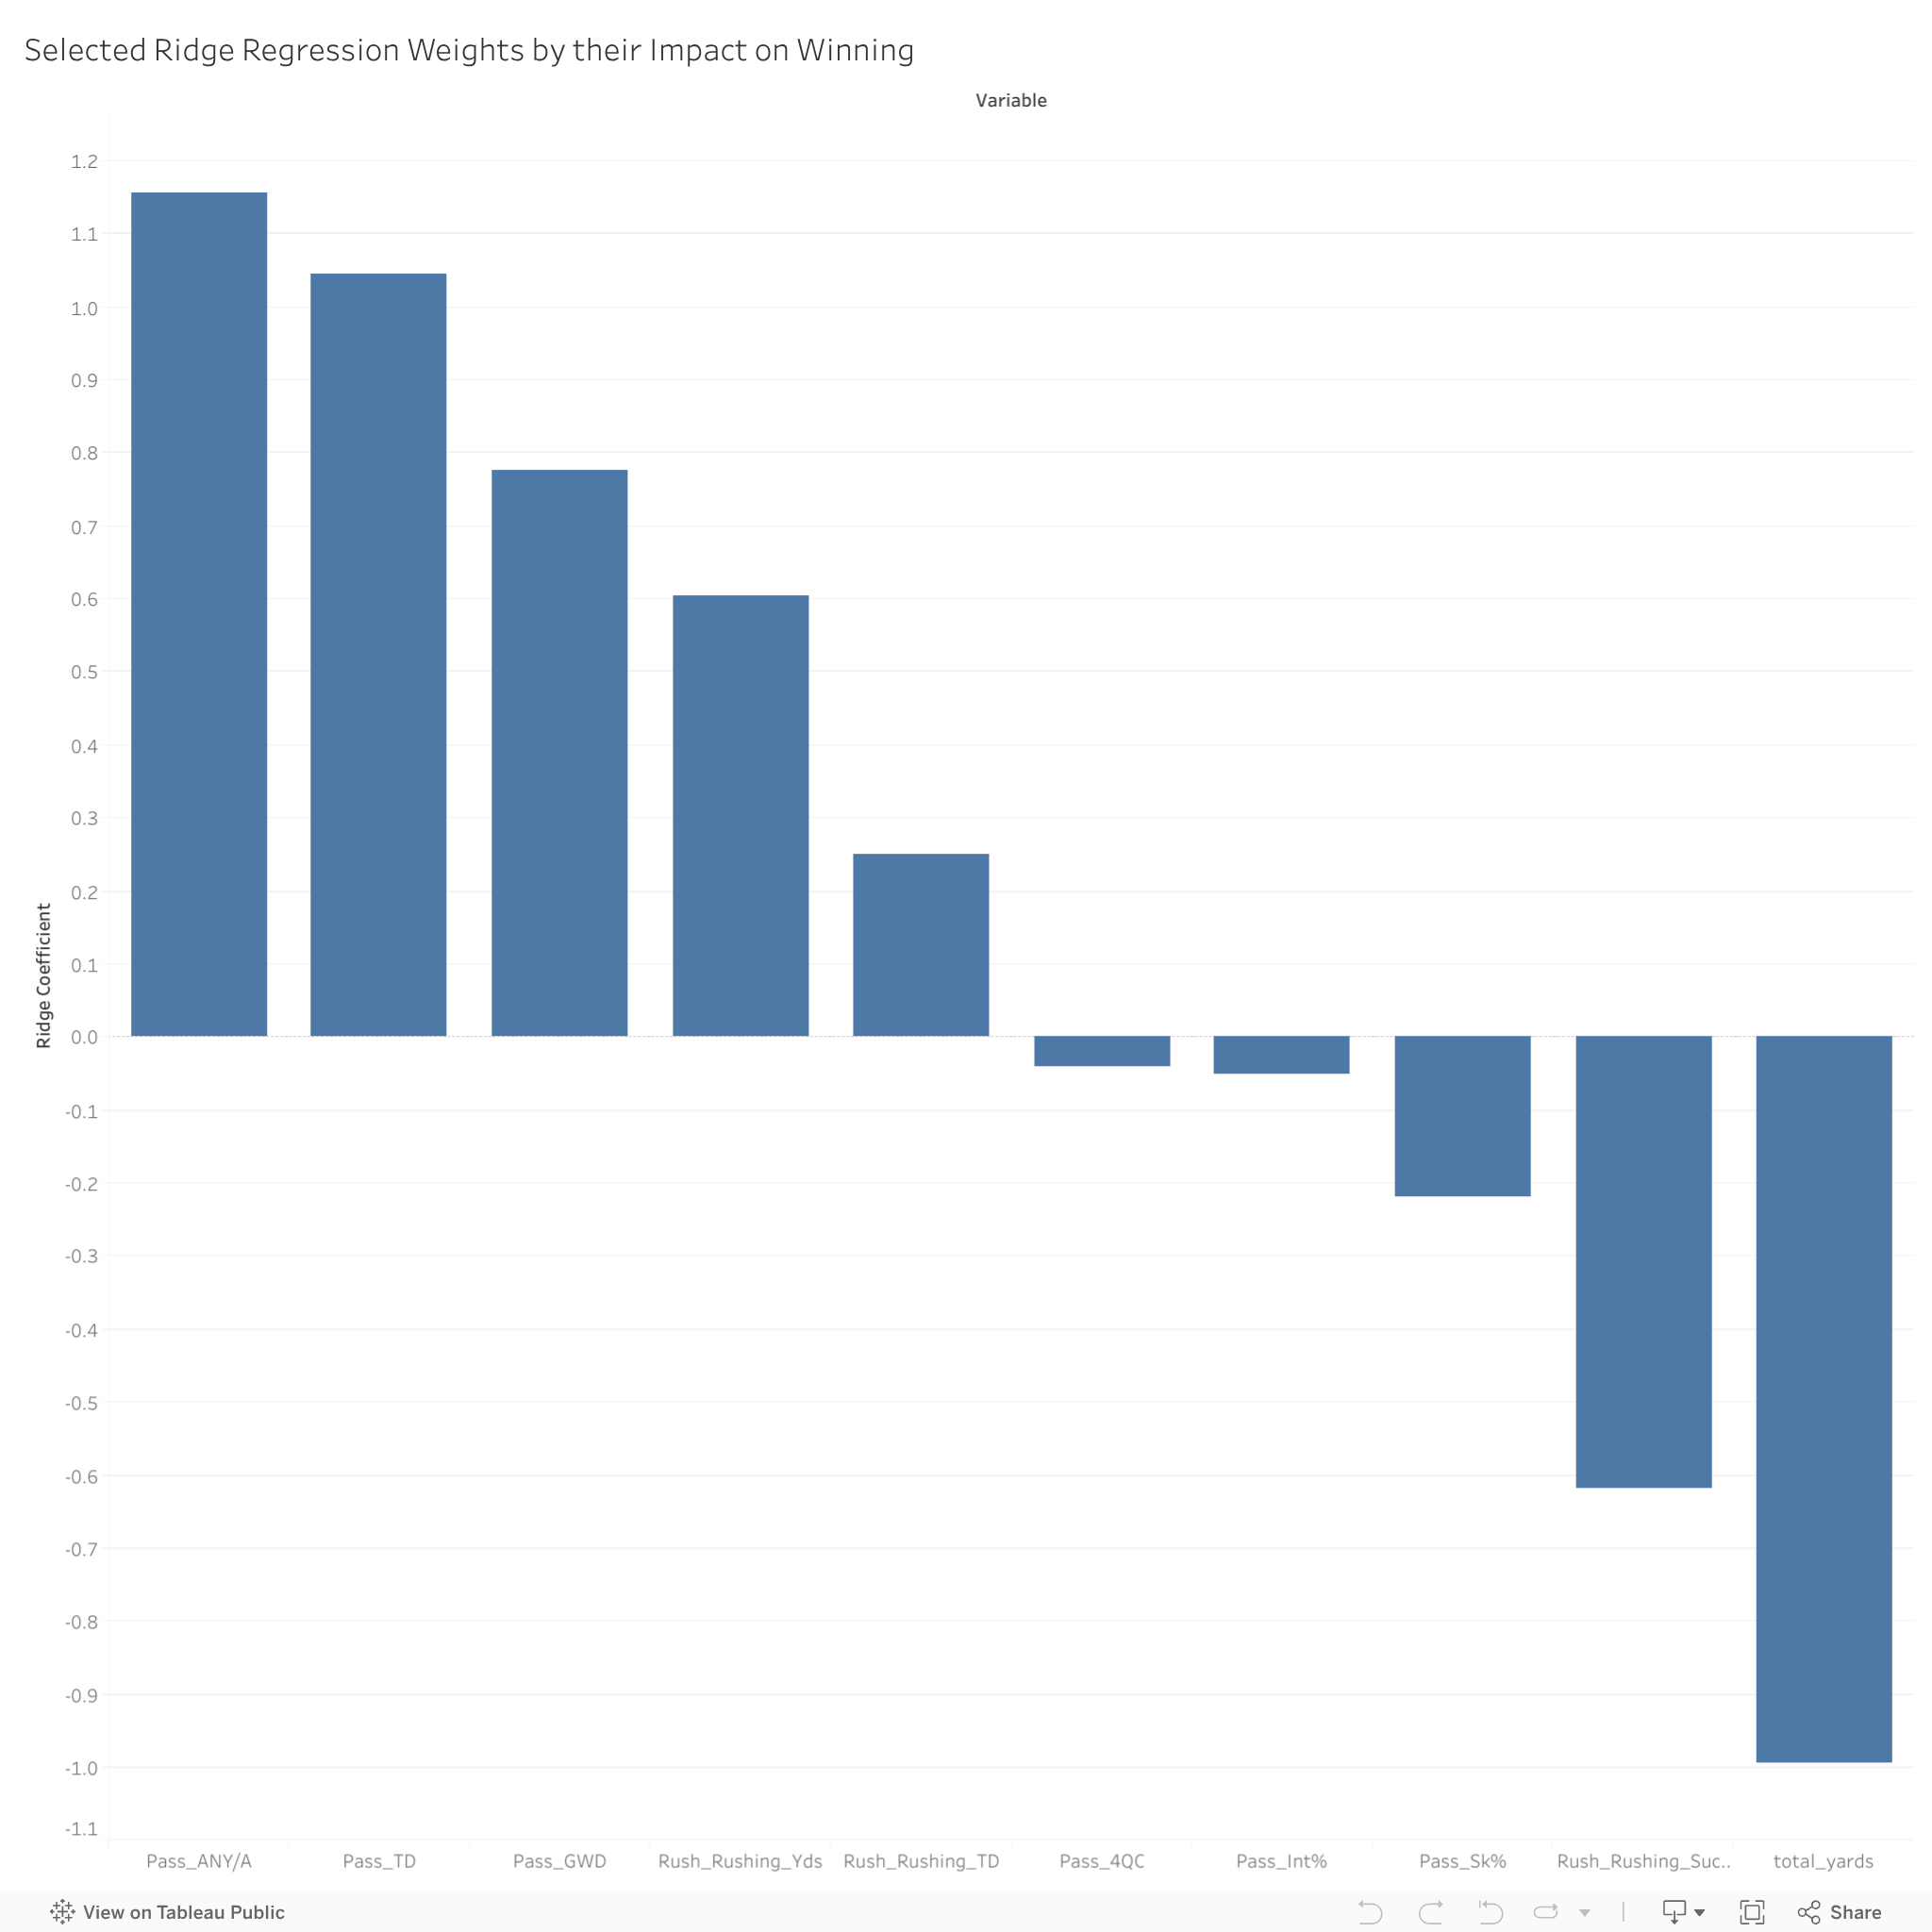
The negative coefficient depicted above for total yards when controlling for efficiency metrics demonstrates the complex relationships between quarterback statistics. This finding suggests that volume production without proportional efficiency gains may indicate sub-optimal game situations or stat padding.
Rushing Success Rate Impact: Ranking as the #5 overall predictor (β = 0.124, p < 0.001), rushing success rate demonstrates meaningful predictive power as the sole remaining rushing statistic. Rushing success rate trails total yards (β = 0.175), touchdown production (β = 0.162), win percentage (β = 0.152), and ANY/A (β = 0.147). This indicates that while dual-threat ability contributes to contract decisions, traditional volume and efficiency metrics remain more influential in organizational evaluation.
Why Rushing Succeeds: Rushing success rate combines pure efficiency (scrambling for first downs when coverage eliminates passing options) with designed offensive schemes that leverage mobility as a primary weapon. The importance of the metric makes sense, since quarterback rushing often occurs after the play breaks down, and the rushes are often for first downs (considered “success” under all down and distance circumstances). While no quarterback metric is truly independent of teammate contribution, quarterback rushing often requires less offensive line protection (or even intentional non-blocking) and less receiver competence post-snap than passing statistics, making it more attributable to individual capability.
Metric Selection for Trajectory Analysis
While rushing success rate demonstrates meaningful predictive power as the 5th-ranked metric, the trajectory analysis in subsequent articles focuses primarily on total yards and ANY/A for several methodological reasons that balance predictive power with analytical robustness.
Sample Size Limitations: Dual-threat quarterbacks represent a minority of the 2000-2024 sample, with the archetype becoming prevalent only in recent years. This creates signal-to-noise concerns when building trajectory models, as the rushing success rate finding may be driven by a smaller subset of highly successful mobile quarterbacks rather than representing a reliable pattern across the full range of quarterback types.
Total Yards as Dual-Threat Capture: The total yards metric (combining passing and rushing yards) was specifically constructed to capture dual-threat ability while maintaining broader sample representation. This allows trajectory analysis to benefit from rushing production insights without over-relying on a metric that may not generalize across the heterogeneous quarterback population in the sample. Total yards can then be adjusted using the offensive inflation factors to effectively compare non-mobile quarterbacks to the dual-threats of today.
ANY/A Robustness: Adjusted Net Yards per Attempt ranks #4 in predictive power as a pure efficiency metric that applies consistently across all quarterback types. As a rate-based measure that accounts for touchdowns, interceptions, and sacks, it provides a stable efficiency baseline for trajectory modeling regardless of offensive scheme or playing time variations.
Conclusions (Pt. 1)
This analysis establishes the analytical foundation for era-adjusted quarterback evaluation, demonstrating through linear regression that offensive inflation significantly biases cross-temporal comparisons. Ridge regression analysis reveals with strong statistical significance that team-level factors (wins, points) dominate individual quarterback metrics in contract decisions, contradicting conventional wisdom about individual merit-based evaluation. Teams claim to prioritize individual skill, but they consistently reward team success instead. Teams that can successfully isolate individual quarterback contribution from team-dependent outcomes should therefore possess significant competitive advantages in both draft selection and contract negotiation, even in today’s data-saturated talent marketplace.
Our methodology validates total yards and ANY/A as the foundation for temporal bias analysis and predictive modeling in subsequent articles. Total yards is the dominant volume metric and ANY/A is the dominant efficiency metric. Rushing success rate demonstrates meaningful predictive power (β = 0.124), confirming that dual-threat capability contributes to evaluation frameworks, though it ranks below traditional volume and efficiency measures.
For teams seeking competitive advantage, the model suggests focusing on era-adjusted volume production (total yards, touchdowns) and efficiency (ANY/A) as primary evaluation dimensions, with dual-threat capability serving as a complementary but not dominant factor in contract decisions.
Articles 2 and 3 will examine temporal weighting bias in quarterback performance evaluation, implement a heat-map of payment probabilities which leverages any biases, and analyse final quarterback trajectories and comparisons.
Footnotes
¹ Ridge Regression: A statistical technique that adds a penalty term to standard regressions to reduce overfitting when predictor variables are highly correlated. It “shrinks” coefficient estimates toward zero, making the model more stable and generalizable.
² Ridge Regression Coefficients: Standardized coefficients that measure the relative importance of each predictor variable while controlling for multicollinearity, with larger absolute values indicating stronger predictive relationships.
³ Train/Test Split: A model validation technique that separates data into a training set (used to fit the model) and a test set (held-out data used to evaluate generalization performance), ensuring the model performs well on unseen data.
⁴ Total Yards: Combined passing and rushing yards per season, era-adjusted to account for league-wide offensive inflation over time.
⁵ Touchdown Production: Combined passing and rushing touchdowns per season, era-adjusted for fair comparison across different NFL eras.
⁶ L2 Regularization: A mathematical technique that prevents overfitting by adding a penalty proportional to the sum of squared coefficients, forcing the model to use simpler relationships.
⁷ Multicollinearity: When predictor variables are highly correlated with each other, making it difficult to determine individual variable importance in standard regression models.
⁸ Adjusted Net Yards per Attempt (ANY/A): (Passing Yards + 20×Passing TDs - 45×Interceptions - Sack Yards) ÷ (Pass Attempts + Sacks). Accounts for touchdowns, interceptions, and sacks in a single efficiency measure.
⁹ Rushing Success Rate: Percentage of rushing attempts that gain ≥40% of yards needed on 1st down, ≥60% on 2nd down, or ≥100% on 3rd/4th down. Measures consistent positive rushing plays.
¹⁰ Standardized Coefficients (β): Regression coefficients scaled so all variables have mean=0 and standard deviation=1, enabling direct comparison of relative importance across different metrics.
¹¹ Passer Rating: NFL’s official quarterback efficiency formula combining completion percentage, yards per attempt, touchdown percentage, and interception percentage on a 0-158.3 scale.
¹² QBR (Total Quarterback Rating): ESPN’s advanced metric attempting to measure quarterback performance including situational context, clutch performance, and team contribution on a 0-100 scale.
¹³ Completion Percentage: Simple ratio of completed passes to total pass attempts, the most basic measure of quarterback accuracy.
¹⁴ RMSE (Root Mean Square Error): Average prediction error magnitude. An RMSE of 1.67 wins means the model’s predictions are typically within 1.67 wins of actual team performance.